MiniStats
MiniStats is a lightweight graphical overlay that displays real-time performance metrics for your PlayCanvas application. It provides essential statistics including draw call count, frame time, CPU load, and GPU load, helping you identify performance bottlenecks during development.
Enabling MiniStats
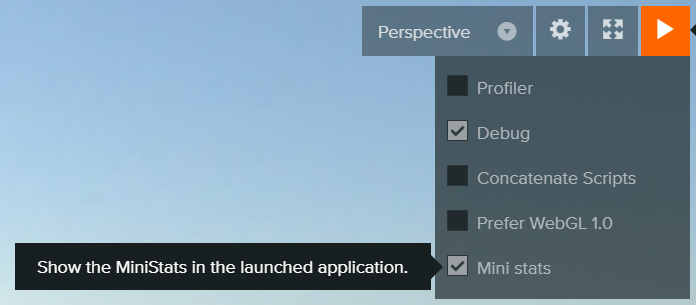
Editor users can enable the MiniStats panel via the Launch button menu:
Display Sizes
Clicking on the MiniStats overlay cycles through three display sizes: small (compact numeric values), medium, and large. The medium and large sizes add graphical timelines and detailed sub-timing breakdowns for both CPU and GPU.
Basic Statistics
The following metrics are always displayed:
| Metric | Description |
|---|---|
| DrawCalls | The number of draw calls dispatched each frame. Each draw call has overhead on both CPU and GPU, so minimizing this number improves performance. |
| Frame | Total time in milliseconds for the browser to process each frame. Target 16.67ms for 60 FPS or 33.33ms for 30 FPS. |
| GPU | Time in milliseconds for the GPU to render each frame. See GPU Timing Requirements below. |
| CPU | Time in milliseconds for CPU-side frame processing, split into update (red) and render (green) portions. |
Detailed Timing Mode
When using medium or large display sizes, MiniStats shows additional timing breakdowns for both CPU and GPU that help identify specific performance bottlenecks.
CPU Sub-Timings
In detailed mode, the CPU graph expands to show individual timing components:
| Stat | Description |
|---|---|
| scriptUpdate | Time spent executing script update methods |
| scriptPostUpdate | Time spent executing script postUpdate methods |
| render | CPU time spent preparing rendering commands and managing GPU resources |
| physics | Time spent in physics simulation |
| anim | Time spent updating the animation system |
| gsplatSort | Time spent sorting Gaussian splats for rendering. This runs in a Web Worker thread and is non-blocking, so it does not impact main thread performance. |
Some CPU stats only appear once they have non-zero values. For example, physics only appears if your scene uses physics simulation.
GPU Pass Timings
In detailed mode, individual GPU render pass and compute pass timings are displayed, showing how long each stage takes. Passes with the same name are aggregated into a single timing value. Common passes include:
- Forward - Main scene rendering
- Downsample - Post-processing downsampling stages
- Upsample - Post-processing upsampling stages
- Compose - Final frame composition
- Compute passes - GPU compute shader dispatches
Detailed GPU pass timing is only available when using the WebGPU graphics backend.
WebGL2 does not support detailed GPU profiling - only the overall GPU frame time is shown. This limitation exists because WebGL's timer query extension only supports measuring elapsed time for the entire frame. Browser security restrictions (Spectre mitigations) prevent the fine-grained timestamp queries needed for per-pass measurements.
GPU Timing Requirements
GPU timing requires specific browser/API support:
| Backend | Requirement |
|---|---|
| WebGL 2 | The EXT_disjoint_timer_query_webgl2 extension must be supported. Check WebGL Report to verify browser support. |
| WebGPU | The timestamp-query adapter feature must be available. This is enabled automatically when supported. |
Using MiniStats Outside of the Editor
While the MiniStats panel is incorporated into the Editor's Launch page, you can also use it independently. To add MiniStats to your application:
const miniStats = new pc.MiniStats(app);
You can customize the display with options:
const miniStats = new pc.MiniStats(app, {
    startSizeIndex: 1,  // Start with medium size
    cpu: {
        enabled: true,
        watermark: 33   // Show 33ms budget line
    },
    gpu: {
        enabled: true,
        watermark: 33
    }
});
For the complete API, refer to the MiniStats API reference. See the MiniStats example for a demonstration of customization options.
See It In Action
Visit the Engine Examples Browser to see MiniStats in action. Try clicking on the overlay to cycle through the different display sizes and observe the detailed timing breakdowns.