GPU Profiling
This section explains how to use native GPU profilers to capture and analyze WebGL or WebGPU frames, enabling debugging and performance profiling of GPU operations.
This is particularly challenging on the Web platform, as web applications typically run within a sandboxed environment, which inherently limits compatibility and integration with native GPU profilers. This page outlines tested options available on certain platforms.
WebGPU applications on macOS with Apple Silicon
-
Clone WebKit:
git clone https://github.com/WebKit/WebKit.git WebKit -
Build MiniBrowser (this takes around 30 minutes):
cd WebKit
Tools/Scripts/build-webkit -cmakeargs="-DENABLE_WEBGPU_BY_DEFAULT=1" --release -
Start the MiniBrowser, specify url to your web application:
__XPC_METAL_CAPTURE_ENABLED=1 Tools/Scripts/run-minibrowser --release --url https://playcanvas.github.io/ -
Configure the number of frames to capture from a separate command-line interface window. This defaults to 1.
notifyutil -s com.apple.WebKit.WebGPU.CaptureFrame 2 -
At the appropriate time, capture the frame(s):
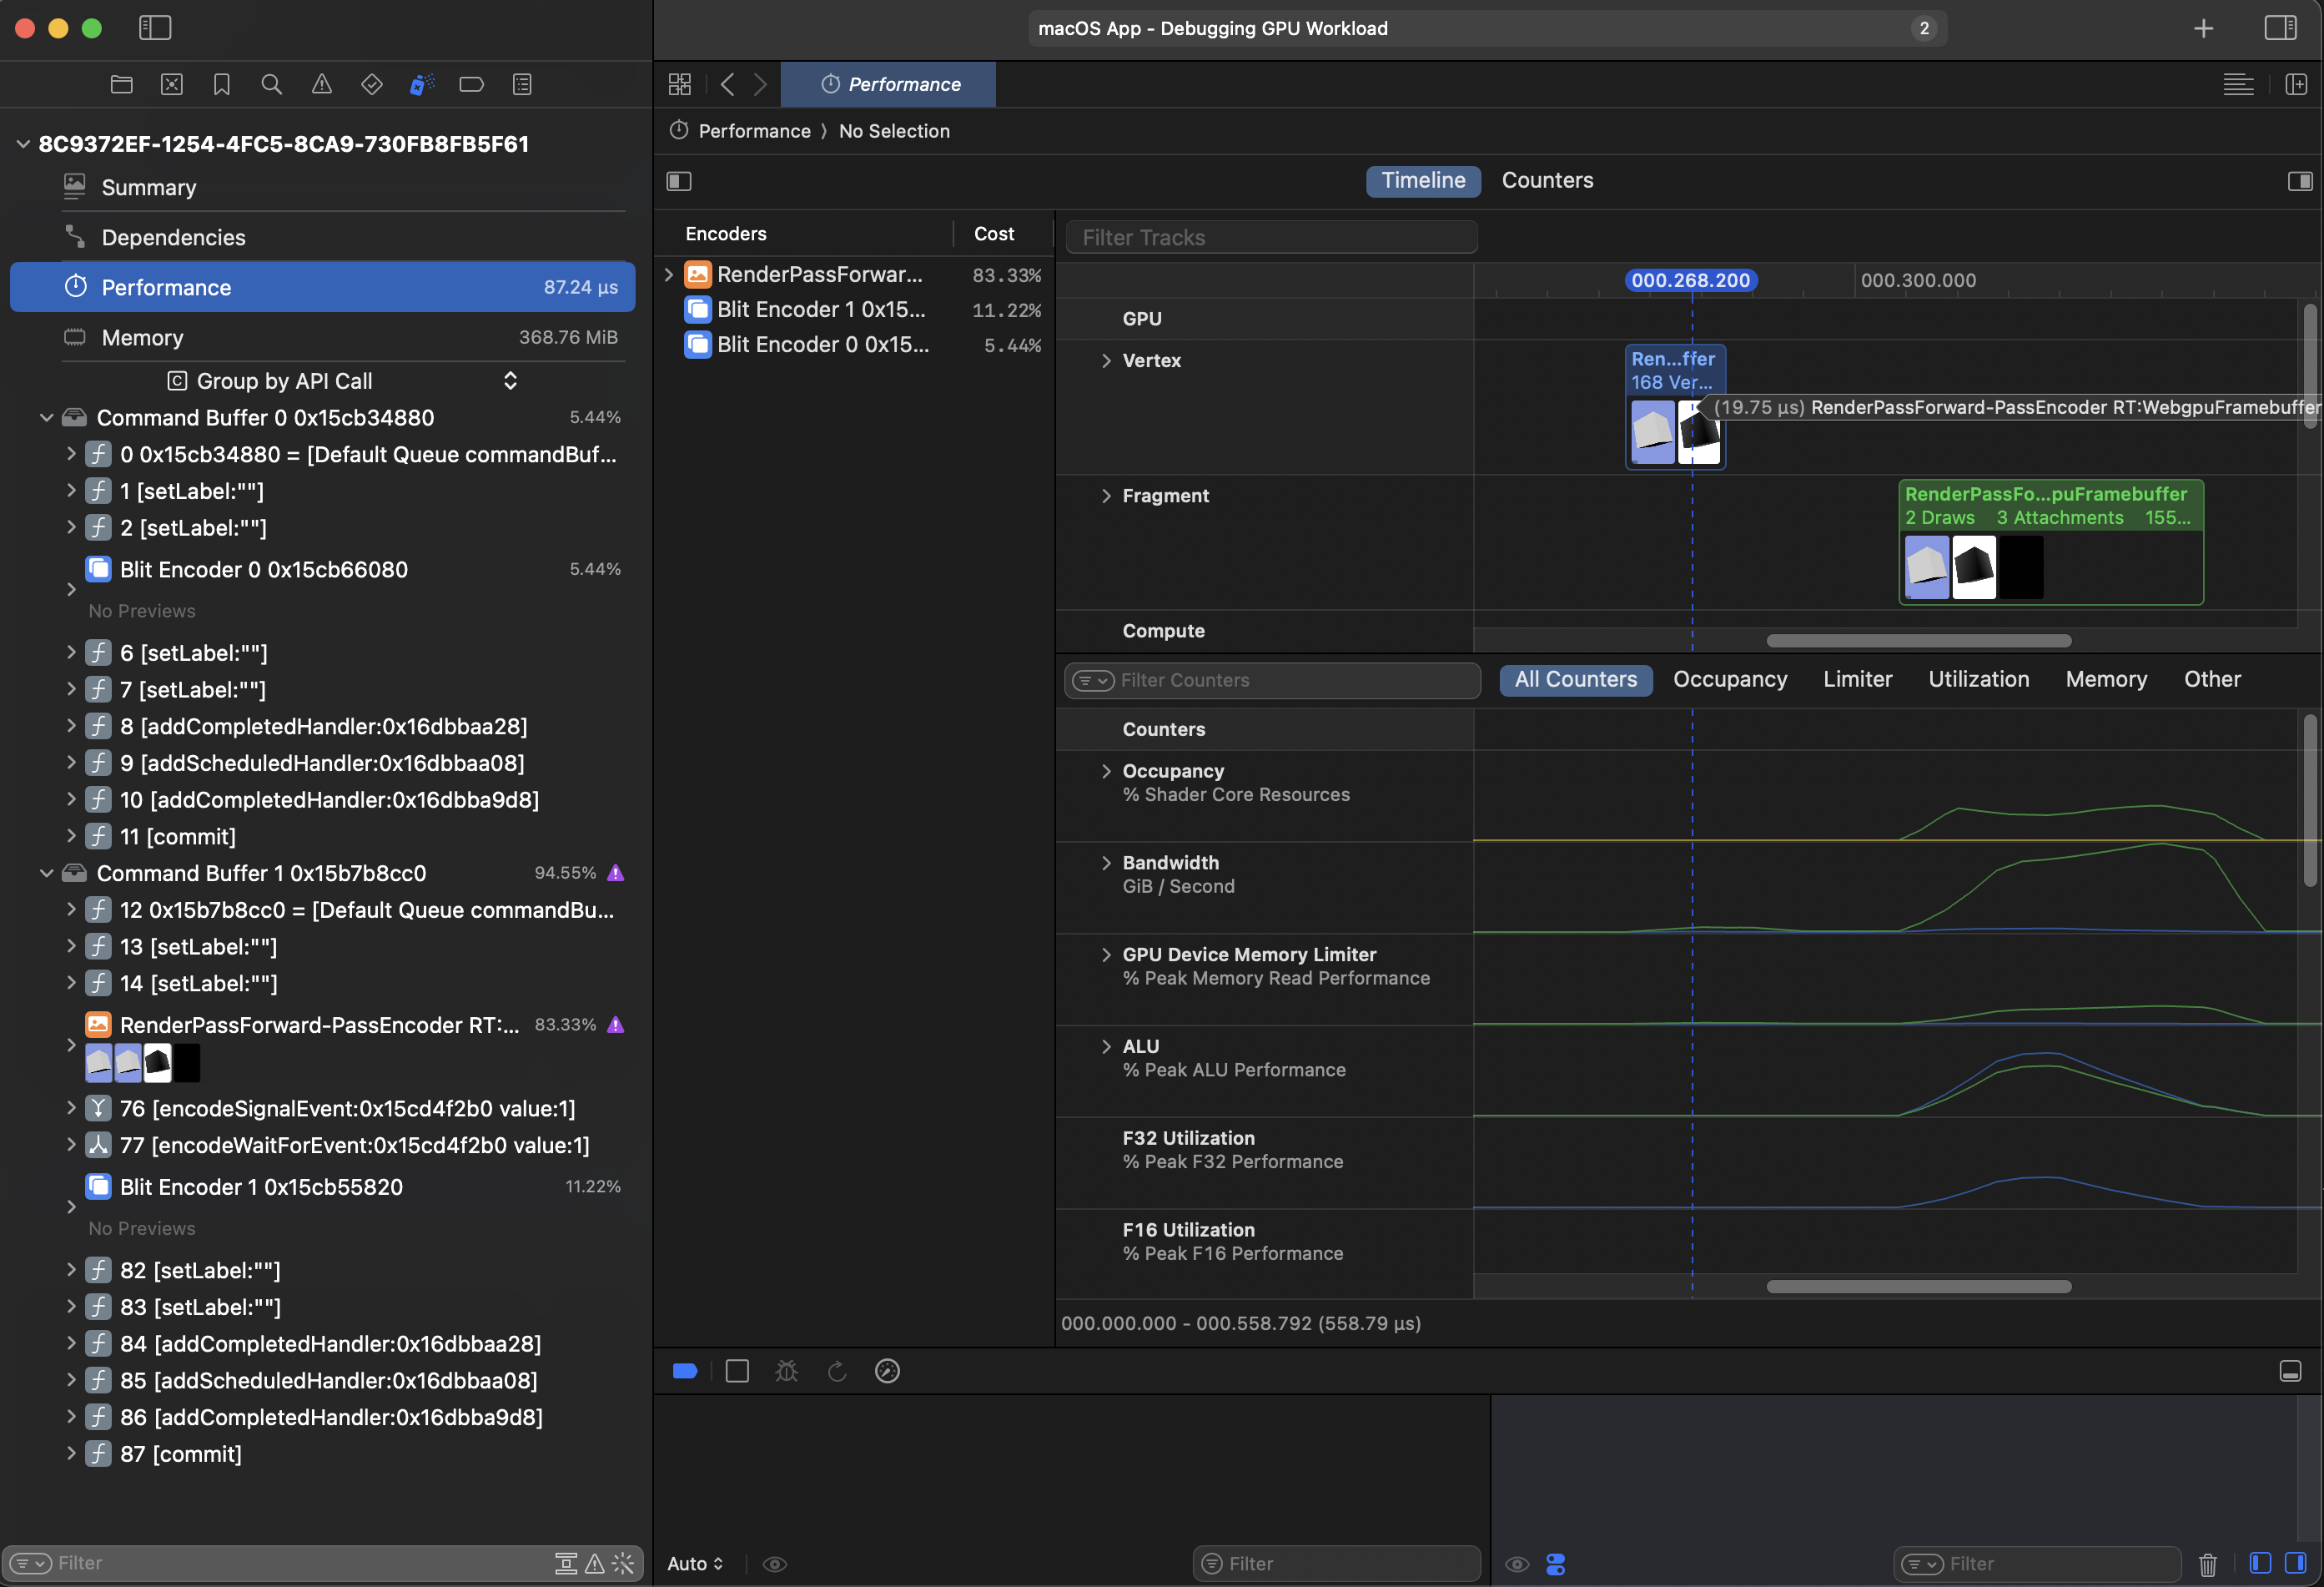
notifyutil -p com.apple.WebKit.WebGPU.CaptureFrameThis generates a capture file, and the command-line window in which you started the MiniBrowser logs a path to it. For example:
Success starting GPU frame capture at path file:///var/folders/m3/cnrw6k214hxd0hq1rf7cy3w40000gn/T/com.apple.WebKit.GPU+org.webkit.MiniBrowser/8C9372EF-1254-4FC5-8CA9-730FB -
Double-click this file to open it in Xcode, then click the Replay button in the dialog that appears. This enables you to inspect frame draw calls, analyze resources, debug shaders, and gather performance metrics.

WebGL applications on macOS with Apple Silicon
The steps above only enable capturing for WebGPU-based applications. To capture a WebGL application, you can embed a small WebGPU application on the same page and capture typically 2–3 frames. This process captures both the WebGPU application and the WebGL application since they both utilize the Metal API under the hood.
For PlayCanvas applications, this process can be simplified by using the provided script. Simply attach it to any single entity in your scene:
https://github.com/playcanvas/engine/blob/main/scripts/utils/mac-gpu-profiling.js
WebGL and WebGPU applications on Windows
Please read this article on how to use Microsoft's PIX to capture GPU frames using the Chrome browser: https://toji.dev/webgpu-profiling/pix
Alternatively, read this article on how to use RenderDoc to capture GPU frames: https://edw.is/renderdoc-webgl/
If you want to use AMD's Radeon GPU Profiler or Nvidia's Nsight with Chrome, read this article.
WebGL applications on Meta Quest
Please read this article on how to use Meta's fork of RenderDoc to capture rendering on Meta's Quest devices.