Data Panel
The SPLAT DATA panel provides statistical visualization and analysis tools for understanding the distribution of data properties across your Gaussian splats. It displays an interactive histogram that allows you to view and select splats based on their attribute values.
Overview
The panel consists of three main sections:
- Data Selector - Choose which splat attribute to visualize
- Histogram Display - Interactive visualization of the selected data distribution
- Statistics - Total counts for splat states
The panel is located at the bottom of the interface and is collapsed by default.
The panel can be toggled open/closed by pressing Ctrl + D (or Cmd + D on Mac) or by clicking the panel header.
Data Selector
The dropdown menu allows you to select from various splat properties for visualization:
| Property | Category | Description | Range/Calculation |
|---|---|---|---|
| X | Position | Position coordinate along the X axis | - |
| Y | Position | Position coordinate along the Y axis | - |
| Z | Position | Position coordinate along the Z axis | - |
| Scale X | Scale | Size of the Gaussian along the X axis | - |
| Scale Y | Scale | Size of the Gaussian along the Y axis | - |
| Scale Z | Scale | Size of the Gaussian along the Z axis | - |
| Red | Color | Red channel intensity | 0-1 |
| Green | Color | Green channel intensity | 0-1 |
| Blue | Color | Blue channel intensity | 0-1 |
| Hue | Color | Color hue | 0-360° |
| Saturation | Color | Color saturation | 0-1 |
| Value | Color | Color brightness/value | 0-1 |
| Opacity | Color | Transparency of each splat | 0-1 |
| Distance | Derived | Distance from the origin (0,0,0) | √(x² + y² + z²) |
| Volume | Derived | Calculated volume of each Gaussian | scale_x × scale_y × scale_z |
| Surface Area | Derived | Approximate surface area | scale_x² + scale_y² + scale_z² |
Histogram Visualization
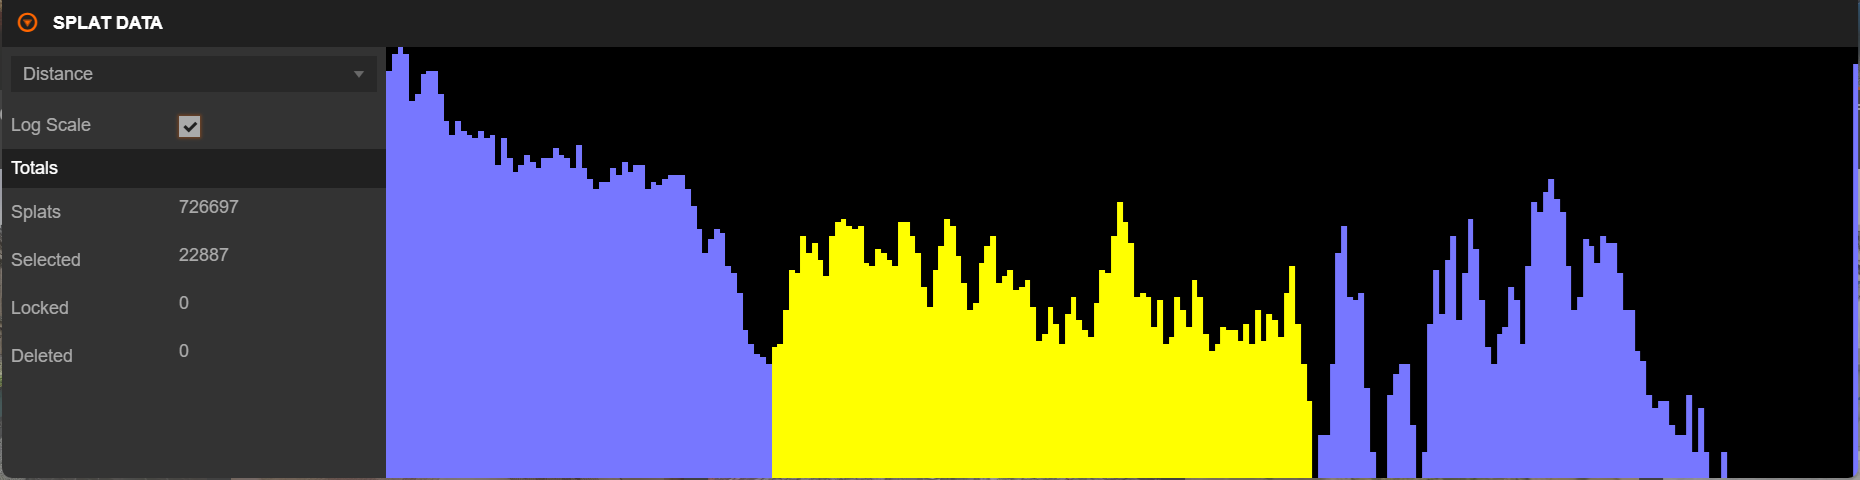
The histogram displays the distribution of the selected property across all non-deleted splats in the scene, with blue bars representing unselected splats and yellow bars representing selected splats. Locked and deleted splats are not shown in the histogram.
Interactive Features
Hover Information - Hover over any histogram bar to see a tooltip displaying:
- value - The data value for this bin
- cnt - Total count of splats in this bin
- percentage - Percentage of total splats
- sel - Number of selected splats in this bin
Selection by Range - Click and drag on the histogram to highlight a range of values. A dashed yellow rectangle will appear showing your selection. Release to select all splats within that value range. Note that locked and deleted splats cannot be selected through the histogram.
Use modifier keys to control the selection operation:
| Modifier Key | Action | Description |
|---|---|---|
| None | New Selection | Replaces the current selection with the histogram range |
| Shift | Add to Selection | Adds the histogram range to the existing selection |
| Ctrl | Remove from Selection | Removes the histogram range from the existing selection |
Log Scale - Enable the Log Scale checkbox to view the histogram with a logarithmic Y-axis. This is useful when data has a wide range of values, when most splats cluster around certain values with few outliers, or when you want to better visualize the distribution of sparse data.
Statistics (Totals)
The bottom section displays real-time statistics about the current splat:
| Statistic | Description |
|---|---|
| Splats | Total number of non-deleted splats |
| Selected | Number of currently selected splats |
| Locked | Number of locked splats |
| Deleted | Number of deleted splats |
These values update automatically when splats are selected, deselected, locked, unlocked, deleted, or reset.
Use Cases
Finding Outliers - Select a property like "Distance" or "Opacity", look for isolated bars at the extremes, then click and drag to select those ranges for examination or deletion.
Color-Based Selection - Choose "Hue", "Saturation", or "Value" and select a range to isolate splats of similar colors, useful for separating objects by color in the scene.
Size-Based Selection - Select "Volume" or "Surface Area", enable "Log Scale" for better visualization, then select ranges to find problematic splats for cleanup or adjustment.
Quality Control - Review the distribution of properties to check if opacity is reasonable, verify scale values are within expected ranges, and identify areas that may need cleanup.
Tips
- Keep the panel collapsed when not in use to improve editor performance
- Check different properties to understand your data better
- Use histogram selection together with other selection tools for precise control
- Understanding your splat distribution helps with optimization and quality improvements
Technical Notes
Data Transformations
Some properties are transformed for visualization to ensure the histogram displays human-readable values rather than the internal storage format:
| Property Type | Transformation |
|---|---|
| Scale values | Exponentiated: exp(value) |
| Color values (RGB) | Converted from spherical harmonics: 0.5 + value × 0.28209479177387814 |
| Opacity | Sigmoid function: 1 / (1 + exp(-value)) |
Suppressed Properties
The following properties are not available for histogram visualization: state (internal state flag), transform (internal transformation data), and f_rest_0 through f_rest_44 (higher-order spherical harmonic coefficients).