Inspector
The Inspector is a debug panel for a running PlayCanvas application. It docks over the canvas and shows the application's scene, GPU resources and rendered frames as they are now, with the properties of whatever you select updating live below.
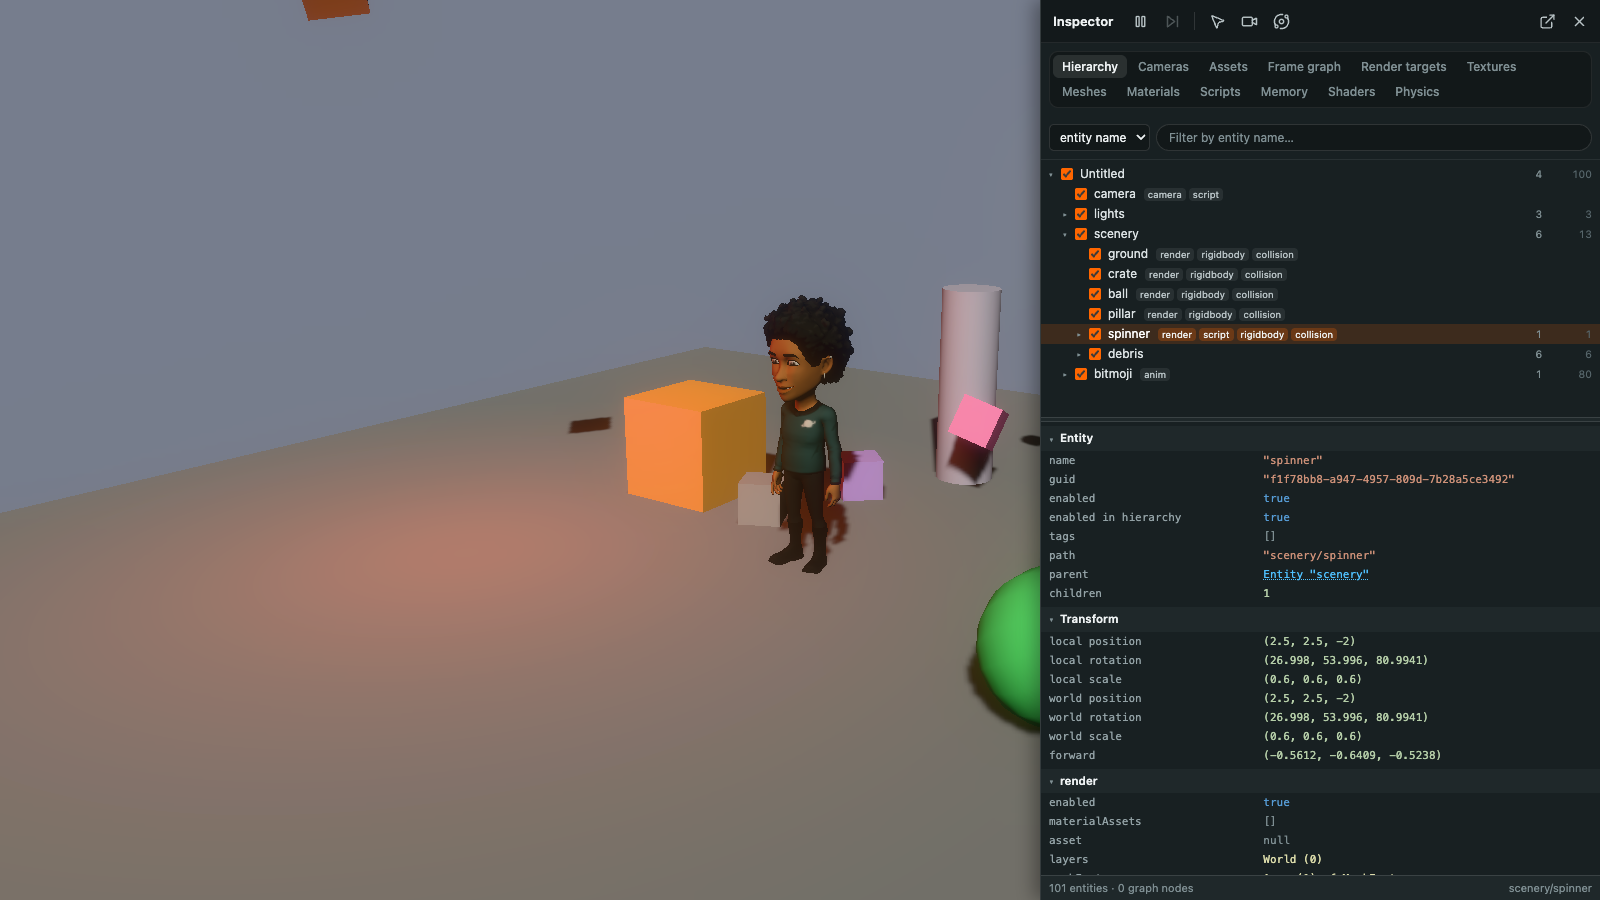
Use it to answer questions such as:
- Why does an entity not show up, and what are its components set to right now?
- Which material and shader does a mesh draw with, and which textures does it use?
- What does a frame render, in which passes and in what order?
- Where does the video memory go?
The Inspector only reads the application. The changes it makes are the ones you ask for: turning entities on and off, pausing and stepping the application, and view-only overrides (render modes, wireframe and a flown or orbited camera), which it removes when it closes.
Adding the Inspector
The Inspector is published as the @playcanvas/inspector package, and needs engine 2.23 or newer.
npm install @playcanvas/inspector
Create it on your application:
import { Inspector } from '@playcanvas/inspector';

const inspector = new Inspector(app, { dock: 'left', width: 480 });
playcanvas is a peer dependency of the package: the Inspector works on your application's own engine, so it must be the same playcanvas package your application imports. Call inspector.destroy() to remove it.
Alternatively, add it to a scene as a script on an entity of its own:
import { EntityInspector } from '@playcanvas/inspector';

const entity = new Entity('inspector');
entity.addComponent('script');
entity.script.create(EntityInspector, { properties: { dock: 'left' } });
app.root.addChild(entity);
Options
| Option | Default | Description |
|---|---|---|
visible | true | Whether the panel starts shown. |
dock | 'right' | The side of the canvas the panel docks to, 'left' or 'right'. |
width | 420 | The width of the panel in CSS pixels. |
top | 0 | A gap left above the panel in CSS pixels, to keep it clear of other overlays. |
toggleKey | 'Backquote' | The key that shows and hides the panel. |
pauseKey | 'F9' | The key that pauses and resumes the application. |
stepKey | 'F10' | The key that advances one frame while paused. |
storageKey | 'pc-inspector' | The local storage key the panel's settings are kept under, such as the active tab and the panel width. null keeps nothing. |
The Toolbar
| Button | Description |
|---|---|
| Pause / Resume (F9) | Pauses the application: time stands still while rendering continues. |
| Step (F10) | Advances one frame while paused. |
| Pick | Hover over the view to outline the entity under the pointer, and click to select it. |
| Fly | Flies the camera with the mouse and WASD, without moving the application's own camera. |
| Orbit | Orbits the camera around the selected entity: drag to orbit, right-drag to pan and use the wheel to zoom. |
| Pop out | Moves the panel into a window of its own, leaving the canvas unobscured. |
Hide (`) | Hides the panel. |
Press Esc to stop picking, flying or orbiting.
Tabs
Each tab lists one kind of object, and the property view below it shows the selected one. Values that refer to other objects, such as the textures of a material or the render target of a pass, are links that select that object in its own tab.
| Tab | Description |
|---|---|
| Hierarchy | The entity tree, filtered by entity name, component or script name. The property view shows the selected entity's transform, every component and every script with its attributes, and the entity is outlined in the view. Each row's checkbox turns the entity on and off. |
| Cameras | The cameras in render order, with where each draws. A render mode shows the scene's material inputs instead of the final image, such as albedo, world normals or lighting, for one camera or all of them, and the scene can be drawn in wireframe. |
| Assets | Every asset in the registry, with its file, its load state and what uses it. |
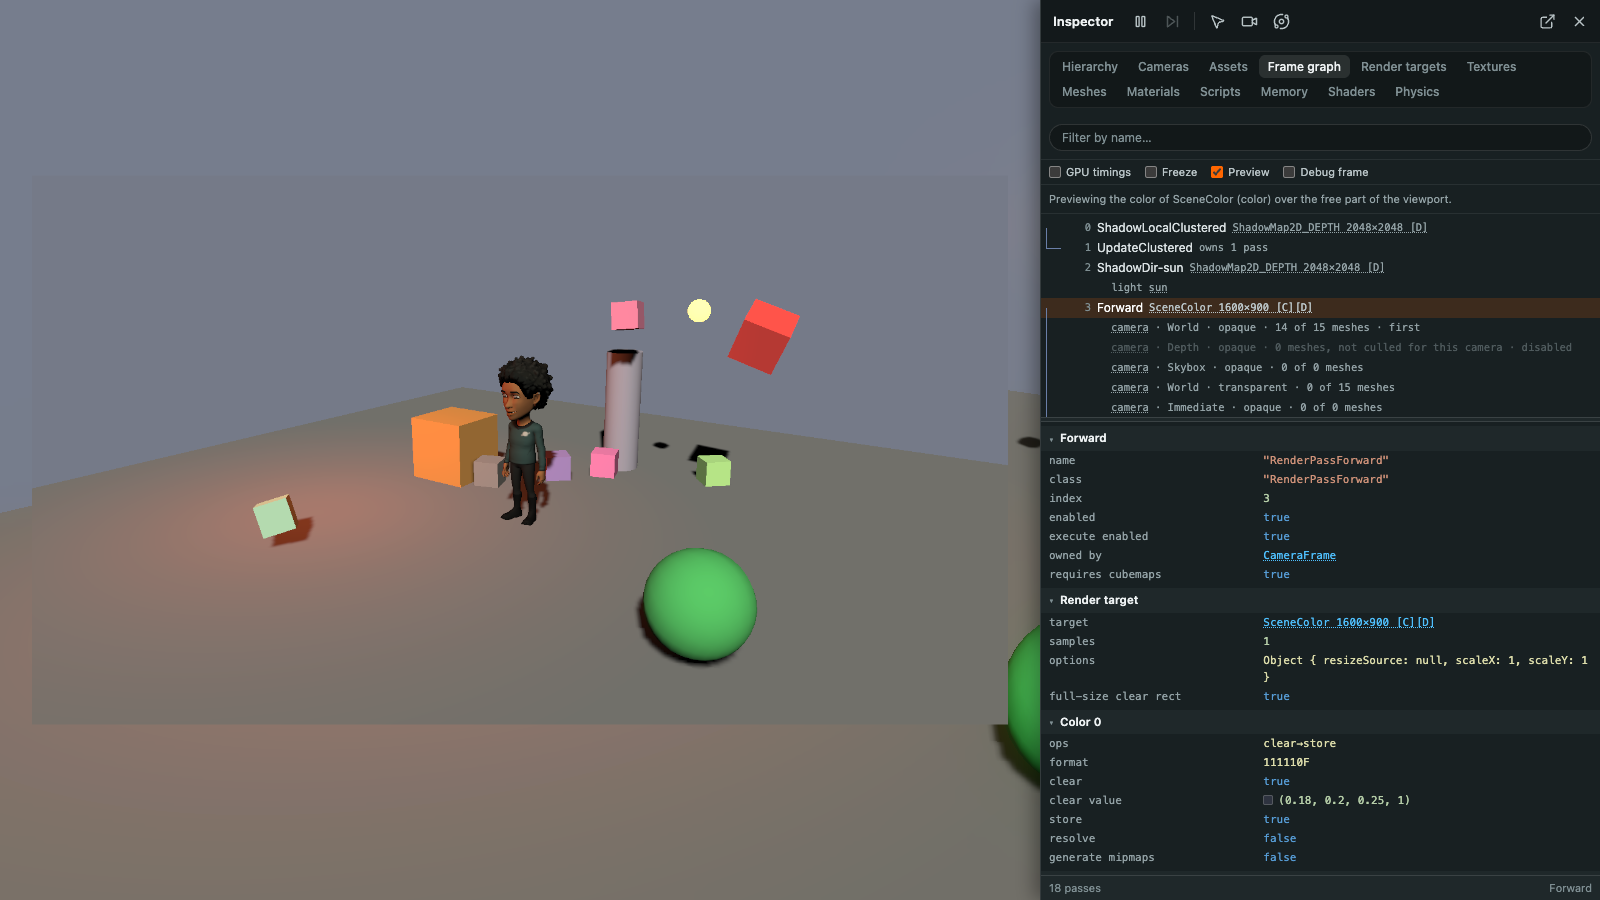
| Frame graph | The passes that rendered the last frame, in order, with the layers, draws and render targets of each. GPU timings shows the time each pass takes on the GPU where the device can measure it, Freeze keeps showing the current frame while the application runs on, and Preview draws the selected pass's render target over the view. |
| Render targets | The render targets on the device, with the passes that rendered into them and a live preview of a chosen attachment. |
| Textures | The textures on the device, largest first, with a live preview and a choice of channels to show. |
| Meshes | The meshes of the application, largest first, with their geometry and what uses them. |
| Materials | The materials of the application, most used first, with their textures, compiled shader variants and what uses them. |
| Scripts | The script classes of the application, with the entities using each, their attributes and their source. |
| Memory | Video memory by kind of resource, and every vertex, index, uniform and storage buffer on the device. |
| Shaders | The compiled shaders, with their sources. |
| Physics | The rigid bodies and joints of the physics world, and an option to draw the world over the scene. |
Stepping Through a Frame
The Frame graph tab can draw a frame one draw call at a time, to see how the image builds up and which draw puts what on the screen.
- Open the Frame graph tab and select a forward pass, or one of its layer steps, such as the opaque meshes of the World layer.

- Turn on Debug frame. The application pauses, and the pass draws only up to the selected draw: the view shows the frame as far as that draw.
- Press the Up and Down arrow keys to step back and forward one draw at a time. The property view lists the drawn mesh instances with the current one highlighted, the view outlines it, and the status bar shows its number, such as draw 8 of 12 · World opaque. Expand an entry to see more about it, such as its mesh and material.
- Turn off Debug frame to draw the full frame again.
Stepping through draws needs the debug build of the engine, and the option is disabled with other builds. Bundlers such as Vite pick the debug build in development through the development export condition of the playcanvas package.
Example
The entity inspector example opens the Inspector on a small scene with lights, physics bodies, scripts and an animated character. Select entities in the hierarchy or pick them in the view, fly or orbit the camera, and explore the other tabs. Press ` to show or hide the panel.